| Rank |
Market address |
Number of existing home sales for 2024 year over year |
Number of existing home sales for 2024 versus 2017-2019 average |
2024 Average current home selling price year over year |
Average current home sale price for 2024 vs. 2017-2019 average |
The combination of existing home sales and price growth in 2024 |
| 1 |
Toledo, OH |
14.0% |
5.2% |
8.3% |
43.4% |
22.3% |
| 2 |
Oxnard-Thousand Oaks-Ventura, California |
18.0% |
-35.1% |
3.3% |
43.3% |
21.3% |
| 3 |
Rochester, New York |
6.2% |
-20.6% |
10.4% |
66.5% |
16.6% |
| 4 |
San Diego-Chula Vista-Carlsbad, CA |
11.0% |
-31.7% |
5.4% |
58.2% |
16.3% |
| 5 |
Riverside-San Bernardino-Ontario, California |
13.8% |
-25.2% |
2.0% |
53.9% |
15.8% |
| 6 |
Bakersfield, California |
13.4% |
-19.8% |
2.3% |
53.3% |
15.7% |
| 7 |
Springfield, MA |
10.5% |
-7.0% |
4.2% |
48.9% |
14.7% |
| 8 |
Worcester, MA-CT |
9.1% |
-17.2% |
4.8% |
61.8% |
13.9% |
| 9 |
Grand Rapids-Kentwood, Michigan |
6.1% |
-20.5% |
7.2% |
72.3% |
13.3% |
| 10 |
Los Angeles-Long Beach-Anaheim, CA |
9.2% |
-31.9% |
3.5% |
45.1% |
12.7% |
| 11 |
Hartford-East Hartford-Middletown, CT |
3.1% |
-13.5% |
9.1% |
59.5% |
12.2% |
| 12 |
Buffalo Cheektowaga, New York |
8.3% |
-9.4% |
3.9% |
55.9% |
12.1% |
| 13 |
Scranton-Wilkes-Barre, PA |
5.5% |
16.2% |
6.3% |
61.0% |
11.8% |
| 14 |
El Paso, Texas |
6.3% |
1.7% |
4.6% |
66.8% |
10.9% |
| 15 |
Harrisburg-Carlisle, Pennsylvania |
5.6% |
-7.6% |
5.1% |
41.3% |
10.6% |
| 16 |
LOUISVILLE/JEFFERSON COUNTY, KY-IN |
9.1% |
-14.1% |
1.2% |
44.1% |
10.2% |
| 17 |
Syracuse, New York |
3.4% |
-12.7% |
6.4% |
65.8% |
9.8% |
| 18 |
Sacramento-Roseville-Folsom, California |
10.3% |
-29.9% |
-1.3% |
40.4% |
9.0% |
| 19 |
Miami-Fort Lauderdale-Pompano Beach, Florida |
3.8% |
-18.2% |
5.0% |
76.4% |
8.8% |
| 20 |
Las Vegas-Henderson-Paradise, Nevada |
11.1% |
-29.9% |
-2.3% |
50.0% |
8.8% |
| 21 |
Augusta-Richmond County, GA-SC |
5.8% |
-5.3% |
1.8% |
52.9% |
7.6% |
| 22 |
Lansing-East Lansing, Michigan |
1.2% |
-14.0% |
6.2% |
42.4% |
7.4% |
| 23 |
Allentown-Bethlehem-Easton, PA-NJ |
2.2% |
-13.2% |
5.0% |
62.3% |
7.3% |
| 24 |
Providence-Warwick, RI-MA |
3.9% |
-26.6% |
3.1% |
56.6% |
7.1% |
| 25 |
New Haven-Milford, CT |
3.5% |
-7.4% |
3.5% |
53.5% |
7.1% |
| 26 |
Akron, OH |
3.2% |
-9.0% |
3.2% |
37.6% |
6.3% |
| 27 |
Portland-South Portland, ME |
8.0% |
-35.2% |
-1.9% |
61.1% |
6.1% |
| 28 |
Bridgeport-Stamford-Norwalk, CT |
-1.3% |
-22.5% |
7.2% |
49.7% |
5.9% |
| 29 |
Orlando-Kissimmee-Sanford, Florida |
3.7% |
-20.7% |
2.2% |
71.8% |
5.9% |
| 30 |
Omaha-Council Bluffs, NE-IA |
1.1% |
-17.9% |
4.5% |
55.4% |
5.6% |
| 31 |
Virginia Beach-Norfolk-Newport News, Virginia – North Carolina |
0.3% |
-9.3% |
5.3% |
45.2% |
5.5% |
| 32 |
Albany-Schenectady-Troy, New York |
1.1% |
-24.7% |
3.7% |
45.3% |
4.9% |
| 33 |
Des Moines-West Des Moines, Iowa |
-5.6% |
-25.8% |
9.9% |
52.1% |
4.4% |
| 34 |
Durham-Chapel Hill, North Carolina |
-1.5% |
-22.7% |
5.8% |
73.8% |
4.3% |
| 35 |
Kansas City, MO-KS |
5.4% |
-22.2% |
-1.2% |
34.9% |
4.2% |
| 36 |
Detroit-Warren-Dearborn, Michigan |
-6.7% |
-27.5% |
10.9% |
49.6% |
4.2% |
| 37 |
OKLAHOMA CITY, OK |
1.9% |
-2.3% |
1.6% |
44.5% |
3.5% |
| 38 |
Little Rock-North Little Rock-Conway, Arkansas |
0.4% |
-5.7% |
3.1% |
37.7% |
3.5% |
| 39 |
Seattle-Tacoma-Bellevue, Washington |
3.9% |
-55.8% |
-1.0% |
55.3% |
2.9% |
| 40 |
Madison, Wisconsin |
3.9% |
-30.4% |
-1.5% |
40.7% |
2.5% |
| 41 |
Greensboro-High Point, North Carolina |
-1.2% |
-3.9% |
3.3% |
55.3% |
2.1% |
| 42 |
New Orleans-Metairie, LA |
-1.1% |
-21.1% |
3.1% |
38.9% |
2.0% |
| 43 |
Dayton-Kettering, Ohio |
-2.9% |
-21.4% |
4.8% |
49.9% |
1.9% |
| 44 |
Washington-Arlington-Alexandria, DC-VA-MD-WV |
-0.8% |
-30.8% |
2.6% |
39.7% |
1.8% |
| 45 |
Cleveland Elyria, Ohio |
-1.2% |
-19.7% |
2.8% |
40.3% |
1.7% |
| 46 |
Baltimore-Columbia-Towson, Maryland |
-3.1% |
-26.4% |
4.6% |
38.1% |
1.5% |
| 47 |
Tulsa, OK |
-1.4% |
-14.3% |
2.8% |
48.5% |
1.5% |
| 48 |
Milwaukee-Waukesha, Wisconsin |
0.2% |
-22.1% |
1.1% |
35.8% |
1.4% |
| 49 |
Knoxville, Tennessee |
-5.9% |
-25.7% |
7.2% |
93.8% |
1.3% |
| 50 |
Albuquerque, New Mexico |
-4.1% |
-38.4% |
5.2% |
59.0% |
1.1% |
| 51 |
McAllen-Edinburg-Mission, Texas |
-0.6% |
-30.4% |
1.6% |
50.8% |
1.0% |
| 52 |
Tucson, Arizona |
2.3% |
-26.1% |
-1.8% |
63.5% |
0.5% |
| 53 |
Columbus, Ohio |
-1.7% |
-25.3% |
2.2% |
53.8% |
0.5% |
| 54 |
CINCINNATI, OH-KY-IN |
-3.9% |
-27.1% |
4.1% |
55.6% |
0.2% |
| 55 |
Phoenix-Mesa-Chandler, Arizona |
4.4% |
-34.7% |
-4.3% |
63.8% |
0.0% |
| 56 |
Lakeland-Winter Haven, Florida |
2.9% |
-3.2% |
-3.5% |
67.8% |
-0.6% |
| 57 |
Boston-Cambridge-Newton, MA-NH |
-0.6% |
-29.1% |
-0.6% |
41.8% |
-1.2% |
| 58 |
Indianapolis-Carmel-Anderson, IN |
-7.6% |
-43.9% |
6.1% |
82.8% |
-1.5% |
| 59 |
Chattanooga, TN-GA |
-3.6% |
-15.1% |
2.0% |
65.2% |
-1.6% |
| 60 |
Pittsburgh, Pennsylvania |
-8.5% |
-26.9% |
6.9% |
43.0% |
-1.6% |
| 61 |
minneapolis st. Paul Bloomington, MN-WI |
-2.4% |
-31.7% |
-0.9% |
35.9% |
-3.3% |
| 62 |
North Port-Sarasota-Bradenton, Florida |
1.3% |
-16.7% |
-4.9% |
67.3% |
-3.6% |
| 63 |
Palm Bay-Melbourne-Titusville, FL |
-6.1% |
-22.5% |
2.3% |
75.7% |
-3.8% |
| 64 |
Wichita, Kansas |
-6.2% |
-35.9% |
2.3% |
41.2% |
-3.9% |
| 65 |
tampa st. Petersburg-Clearwater, Florida |
-5.3% |
-28.7% |
1.2% |
85.4% |
-4.1% |
| 66 |
San Francisco-Oakland-Berkeley, California |
-0.8% |
-32.9% |
-5.2% |
19.2% |
-6.0% |
| 67 |
Jacksonville, Florida |
-5.8% |
-18.1% |
-0.5% |
59.8% |
-6.2% |
| 68 |
Birmingham-Hoover, AL |
-4.9% |
-20.3% |
-1.5% |
32.3% |
-6.3% |
| 69 |
Fresno, California |
-6.0% |
-40.8% |
-0.3% |
44.8% |
-6.3% |
| 70 |
Spokane-Spokane Valley, Washington |
3.6% |
-64.0% |
-10.2% |
39.7% |
-6.6% |
| 71 |
City of Boise, ID |
-3.2% |
-49.2% |
-3.4% |
60.5% |
-6.6% |
| 72 |
Cape Coral-Fort Myers, Florida |
-3.7% |
-11.8% |
-2.9% |
71.2% |
-6.6% |
| 73 |
Deltona-Daytona Beach-Ormond Beach, FL |
-3.7% |
-19.9% |
-3.1% |
64.2% |
-6.9% |
| 74 |
Winston-Salem, North Carolina |
-8.0% |
-12.6% |
0.3% |
53.0% |
-7.7% |
| 75 |
New York-Newark-Jersey City, NY-NJ-PA |
-10.8% |
-37.5% |
3.0% |
47.7% |
-7.8% |
| 76 |
Chicago-Naperville-Elgin, Illinois-Wisconsin |
-9.2% |
-36.7% |
1.1% |
32.6% |
-8.1% |
| 77 |
Richmond, Virginia |
-11.6% |
-34.2% |
3.3% |
50.7% |
-8.3% |
| 78 |
Stockton, California |
-5.8% |
-37.2% |
-3.7% |
40.7% |
-9.5% |
| 79 |
Charleston-North Charleston, South Carolina |
-13.2% |
-26.6% |
3.7% |
75.4% |
-9.5% |
| 80 |
Philadelphia-Camden-Wilmington, PA-NJ-DE-MD |
-13.4% |
-36.0% |
3.8% |
48.5% |
-9.6% |
| 81 |
Urban Honolulu, hello |
-8.9% |
-47.2% |
-1.9% |
19.4% |
-10.7% |
| 82 |
Greenville-Anderson, SC |
-12.4% |
-34.8% |
1.0% |
61.3% |
-11.4% |
| 83 |
Colorado Springs, CO |
-11.5% |
-42.5% |
-1.7% |
54.5% |
-13.2% |
| 84 |
Raleigh Cary, North Carolina |
-17.0% |
-41.2% |
3.6% |
70.8% |
-13.4% |
| 85 |
St. Louis, MO-IL |
-2.3% |
-47.1% |
-11.7% |
13.3% |
-14.0% |
| 86 |
Columbia, SC |
-12.3% |
-26.4% |
-1.8% |
50.5% |
-14.1% |
| 87 |
Salt Lake City, Utah |
-10.2% |
-51.7% |
-4.1% |
50.5% |
-14.2% |
| 88 |
Houston-The Woodlands-Sugar Land, Texas |
-9.7% |
-26.7% |
-4.5% |
33.3% |
-14.3% |
| 89 |
Memphis, TN-MS-AR |
-10.8% |
-30.0% |
-4.1% |
33.5% |
-14.9% |
| 90 |
San Jose-Sunnyvale-Santa Clara, California |
-18.5% |
-44.1% |
3.1% |
37.3% |
-15.3% |
| 91 |
Atlanta-Sandy Springs-Alpharetta, Georgia |
-15.8% |
-41.0% |
0.4% |
63.3% |
-15.4% |
| 92 |
Nashville-Davidson-Murfreesboro-Franklin, Tennessee |
-11.4% |
-35.0% |
-4.8% |
51.3% |
-16.2% |
| 93 |
Ogden-Clearfield, Utah |
-15.1% |
-53.1% |
-3.8% |
57.2% |
-18.9% |
| 94 |
San Antonio-New Braunfels, Texas |
-10.1% |
-28.9% |
-9.4% |
27.3% |
-19.5% |
| 95 |
Denver-Aurora-Lakewood, CO |
-15.3% |
-41.8% |
-5.1% |
35.4% |
-20.4% |
| 96 |
Dallas-Fort Worth-Arlington, Texas |
-12.9% |
-35.3% |
-8.4% |
31.4% |
-21.4% |
| 97 |
Charlotte Concord Gastonia, NC-SC |
-22.4% |
-45.6% |
-0.9% |
58.0% |
-23.3% |
| 98 |
Austin-Round Rock-Georgetown, Texas |
-11.7% |
-39.7% |
-12.2% |
29.1% |
-23.9% |
| 99 |
Baton Rouge, LA |
-20.4% |
-38.6% |
-5.6% |
17.8% |
-25.9% |
| 100 |
Portland-Vancouver-Hillsboro, OR-WA |
-25.6% |
-61.3% |
-7.4% |
23.7% |
-33.0% |
“Amateur organizer. Wannabe beer evangelist. General web fan. Certified internet ninja. Avid reader.”


 The Lion King trailer has been revealed with Blue Ivy Carter joining the cast
 The king of dinosaurs was not a genius! Scientists are pouring cold water on the theory that the T.Rex was as smart as an ape
 After Knicks fans invade 76ers arena, Joel Embiid calls home crowd turnout 'disappointing'
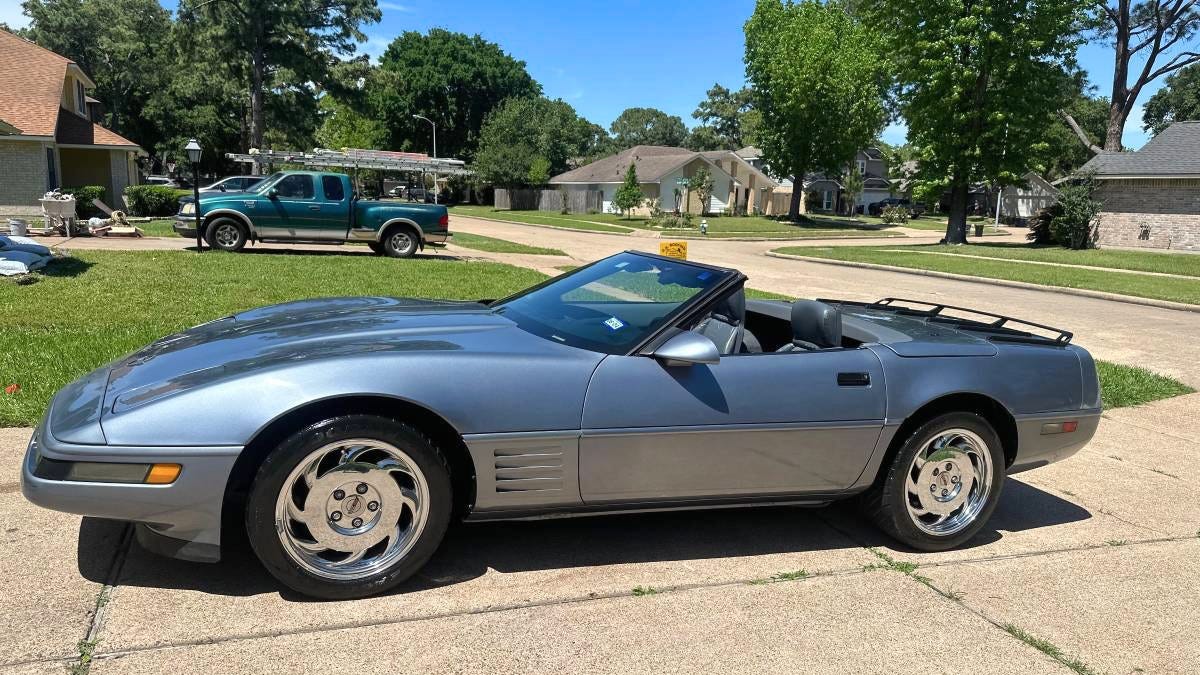 At $7,400, is this 1991 Chevy Corvette an “extremely rare” deal?
 The United States buys 81 Soviet fighter planes from its Russian ally for $19,000 each: report

More Stories
Shari Redstone is playing M&A war games with Paramount CEO removed
Exploring the XRP sell-off: When whales start exiting, should they do the same?
Tesla CEO Elon Musk visits China to attend FSD after Nixing trip to India